
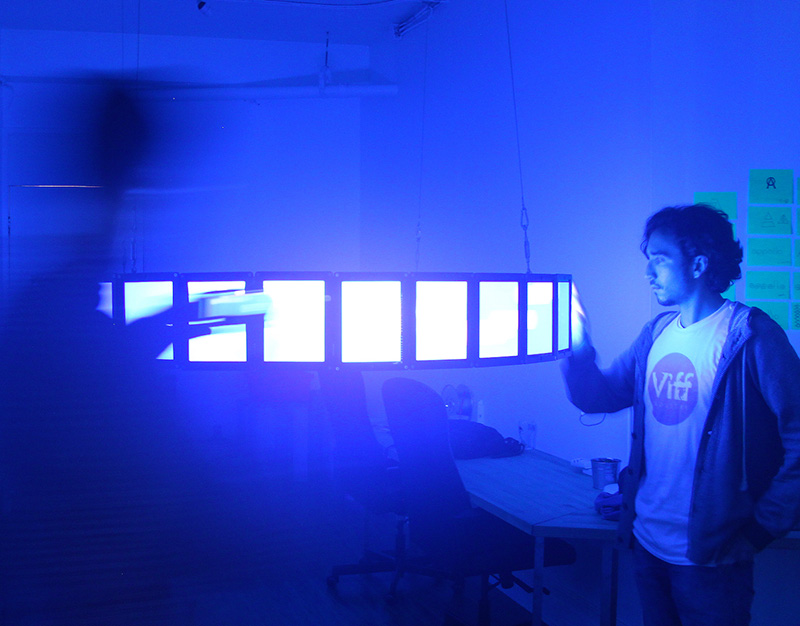

Interactive Wall
The Interactive Wall is a dynamic data visualization installation that was designed and developed for the Indian Residential School History and Dialogue Centre. Located in the exhibiton space of the IRSHDC building at the University of British Columbia, the Wall is meant to provide visitors with an engaging, dynamic and multi-faceted means for exploring historical and contemporary digital records about the Indian Residential School program.
Map Explorer
The Map Explorer is, typically, the first interface a visitor sees when they arrive at the exhibition space. The default state shows 3 instances of Canada – one on each screen. Just like an iPad, you can pinch to zoom and pan to move around. Pins indicate the location of a School or Event, and tapping one of those will open a record.
What you see above is a modified version of Apple Maps, programmed to only show Canada. It displays a custom set of tiles that were created usinig geo data from Canada's National Research Council. If a single person is interacting with the installations, the other screens will sync to that visitor's actions.
Record Navigator
The Record Navigator sits above all the visualization layers in the installation and is the main interface for learning. From the Map Explorer, engaging with content starts by tapping a pin to open a record.
Records have a title, text and a thumbnail image. A record's related items can be shown by tapping the + button at the top right.
Custom Views & Touches
Content can be seen in a variety of custom views such as: records, images, PDFs, videos. The video on the left shows the opening of records, navigation through related items, and zooming into images and highlights how smoothly touches / gestures work on MacOS. Yes... That's right... Unlike iOS, MacOS doesn't have its own multitouch gesture framework, so we rolled our own touch kit that works seamlessly with Finder.
Timeline
Events and records, such as the opening of individual Residential Schools and Truth & Reconiliation Commission hearings are displayed on a timeline. Like the Map Explorer, the Timeline can be controlled by a single person or split down into 6 unique visitor sessions. Unlike the map, this interface cannot be zoomed. However, it can be dragged up and down the screen, adjusting to a visitor's height – there is also a small buttton in the bottom corner of the screen that will drop the UI if it cannot be reached.
Multiple Users
A decent problem to solve was how we would allow multiple users to interact with the installation at the same time. On one hand, having an expansive and seamless screen plays beautifully with perception and allows visitors to easily interact with one another without bezels getting in the way. On the other hand, having multiple bezels means that individual interactive sessions would be easily contained to a smaller screen positioned in portrait mode.
Opting for larger screens but not a full bezel-less solution meant greater touch fidelity but required digitally subdividing each screen. We crafted some very robust software to handle the logic for when a screen should sync, divide, or control other screens. This took a lot of work but paid off because the feeling how the various sessions interact is smooth.
The Map and Timeline interfaces can be divided into 6 sessions, while the Node interface only appears to divide – it doesn't actually, but it looked weird if it didn't, so we put a bit of lipstick on it.
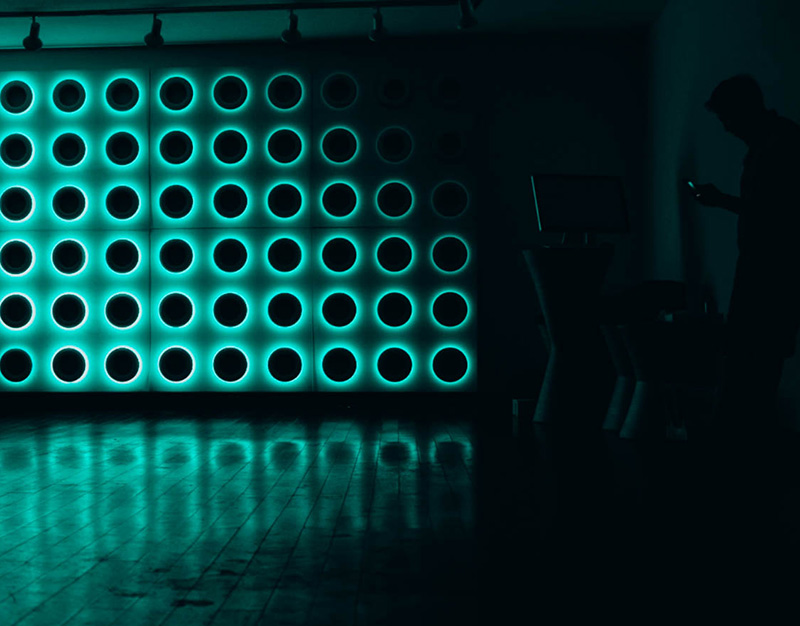
Node Visualization
This lovely abstract representation of the installation's content is a mix of ambient aesthetic and playful interaction. Each node represents a theme. Drag a theme around and it will bump into other themes. Tap it and all its related records will fly into view. Using a custom physics algorithm, related items distribute themselves organically. To view a theme's record, tap on the little + icon at the bottom of the circle.
Open Source
We've open-sourced the major components of this project, and it's free to use for anyone willing to take the plunge. That said, you will need a few things for everything to come together. First, an HID compliant touch screen is necessary – for testing purposes we used a Planar Helium 2485 (reasonably priced). Second, you'll need a Raspberry Pi to process touches coming from the screen. Third, you'll need a Mac to run the application software. Along with the core source code are 3 simplified apps for Map, Timeline and Node interfaces.
Interactive Wall – The core software that drives the installation. This one includes all the software for the three main visualizations, the record navigator, browsing, etc.
Mac Gestures – Touch gesture library for MacOS & AppKit.
Network Touch Provider – An HID compliant touch broadcasting application. This is used to process data coming in from a multitouch screen.
Map Demo – A simplified version of the Map interface – it's essentially Apple Maps.
Timeline Demo – A simplified version of the Timeline interface – it's essential iCal.
Nodes Demo – A simplified version of the Node interface – it uses SpriteKit.
L&F Team
Travis Kirton
Tim Davis
Alejandro Isaza
Nicolas Prieto
Ryan Betts
Jesse Cathcart
Harrison Turley
June Ha
Spencer Perkins
Jeremy Voldeng
Andrew Dworschak
Melissa Webb
Jeremie Benhamron
Director
Lead Developer
Senior Software Engineer
User Interface Design
User Experience Design & Research
Production & Video
Software Engineer
Software Engineer
Software Engineer
Software Engineer
User Research & Data Viz & Software Engineer
User Research
Pinch Hitter
Collaborators
Residential School History & Dialogue Centre — Client — Produced all curated content for the installation, and oversaw coordination of production teams.
Whirl-i-Gig — Produced a customized version of Collective Access, the content management system used by the RSHDC team to process, edit and curate digital records.
Applied Electronics — Resellers of hardware and installation specialists.
